
Have zero experience with design? Lack the creativity to build an infographic? You’re not alone! Building an infographic, coming up with a design and finalizing a draft copy can be frustrating and time consuming. Lucky enough, we have compiled everything you need to know and the tools to build the best infographic.
Content & Information
The content and information presented on the infographic is the most important aspect of the infographic. No matter how beautiful the graphic looks, everything would be ruined if the content is confusing. The reader needs to understand the information that’s being delivered.
It’s a common mistake that people start first by designing the graphic. Rather, you should start by finalizing the content and information. Designing the infographic should come after, picking the photos, icons, and layout that best supports the content.
Collect data & choose template
Building the graphic is the most time-consuming part. Luckily, there are free services and tools you can use to create an infographic. Don’t worry, Photoshop is not on the list.
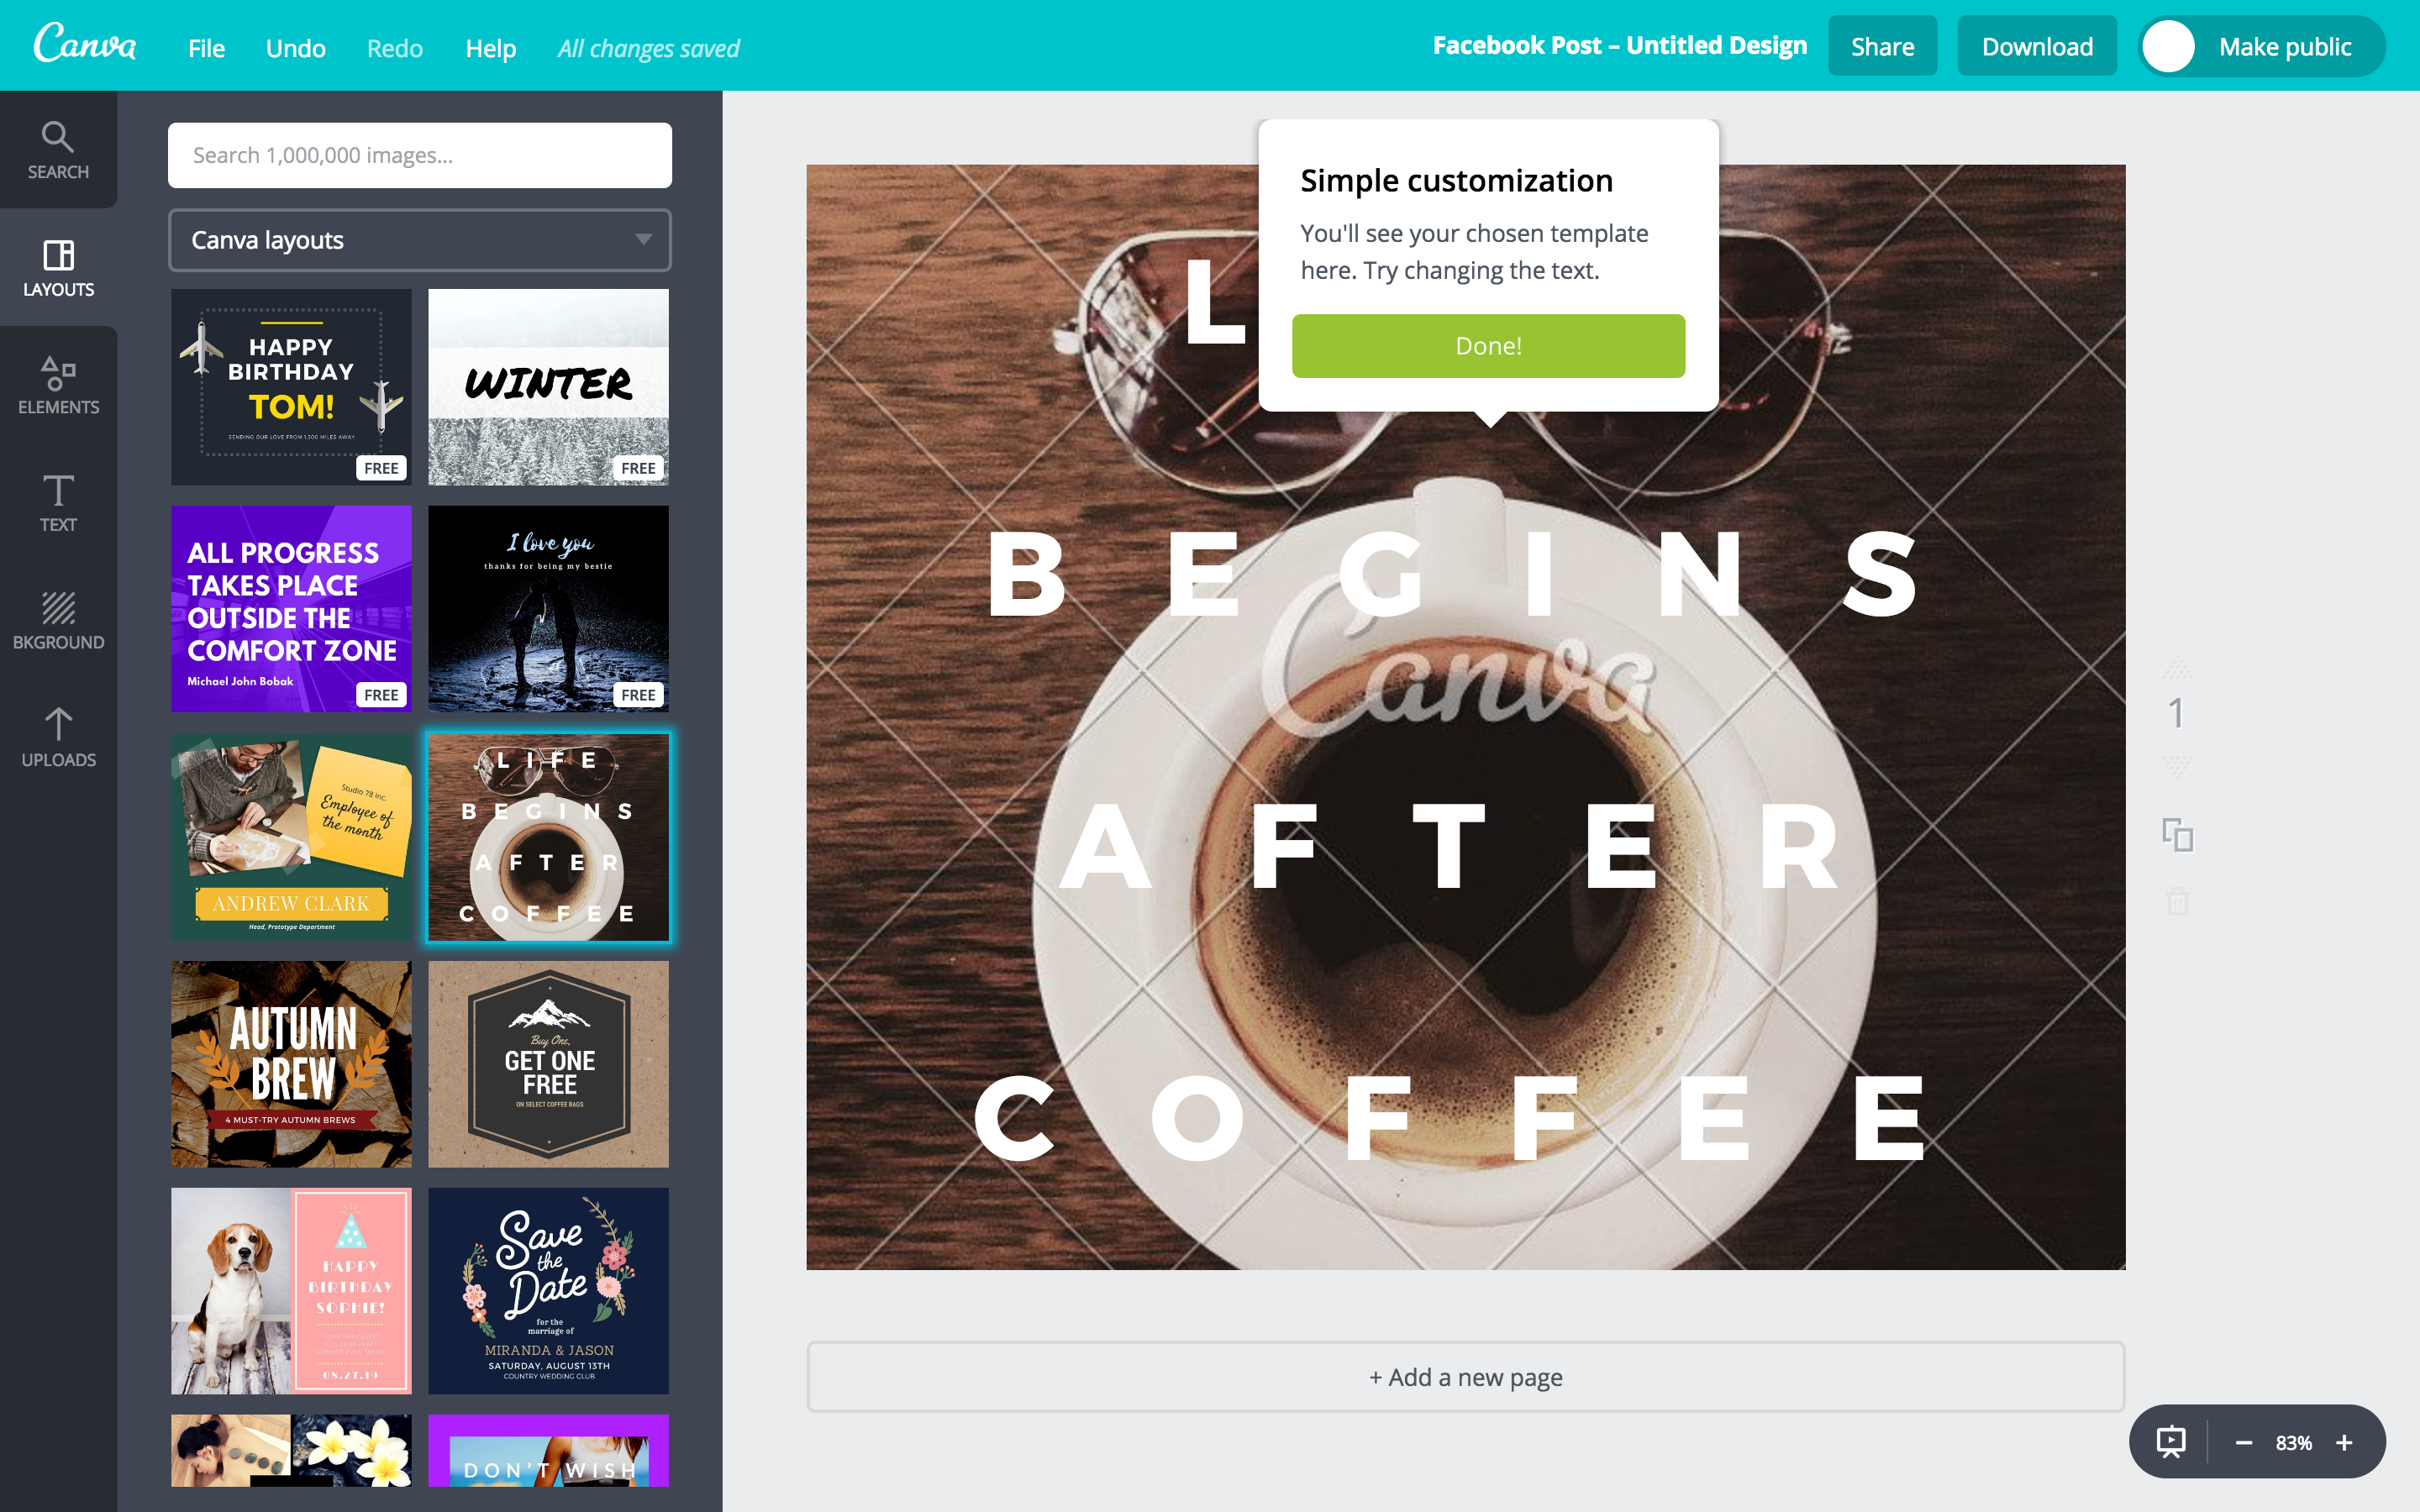
1. Canva
All you need is an email address and you can create an account to start designing. At the beginning, you have the choice to pick if the graphics should be tailored for work, personal use or social media. There are templates preloaded for the project you choose to tackle.
Canva also includes a quick tutorial to get you started. It’s easy to use, there is a large library of photos to pick from, templates for Facebook posts, blogs, business cards, presentations, twitter and more!

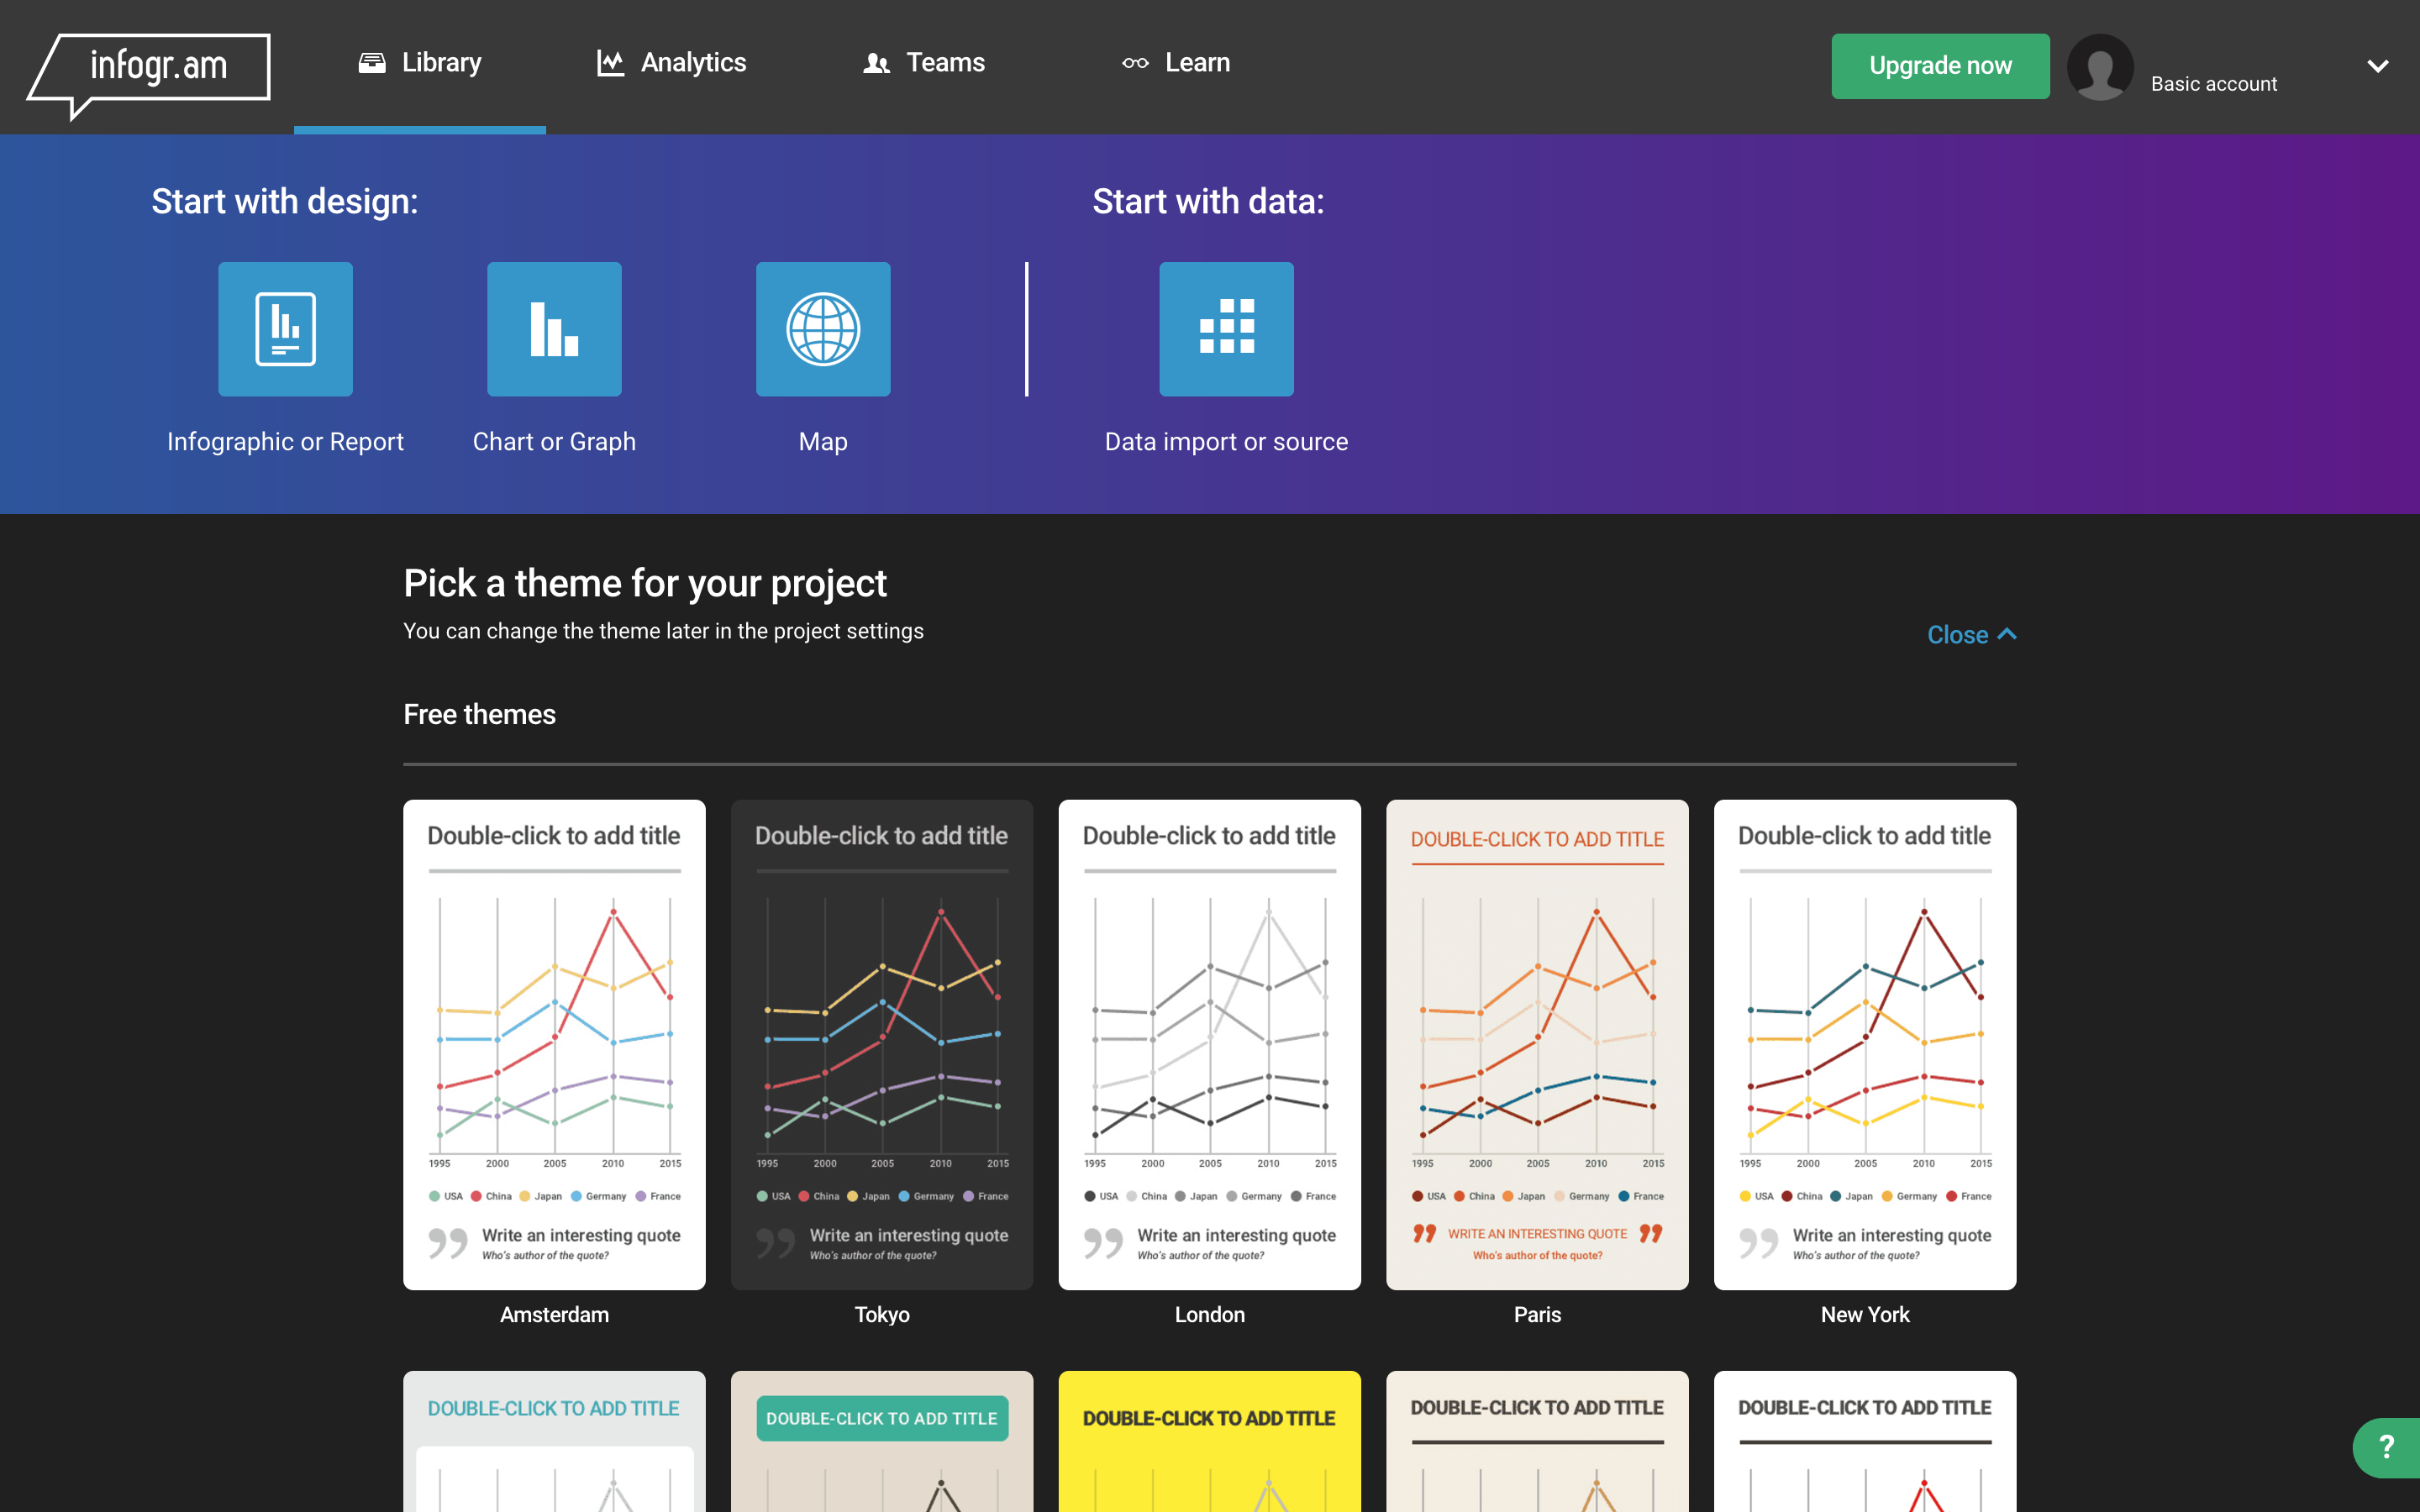
2. Infogr.am
Infogr.am is another tool that offers a wide selection of charts, graphs and maps. Start by selecting a category for the infographic, then get started instantly. You can even customize the graphic by uploading photos and videos.
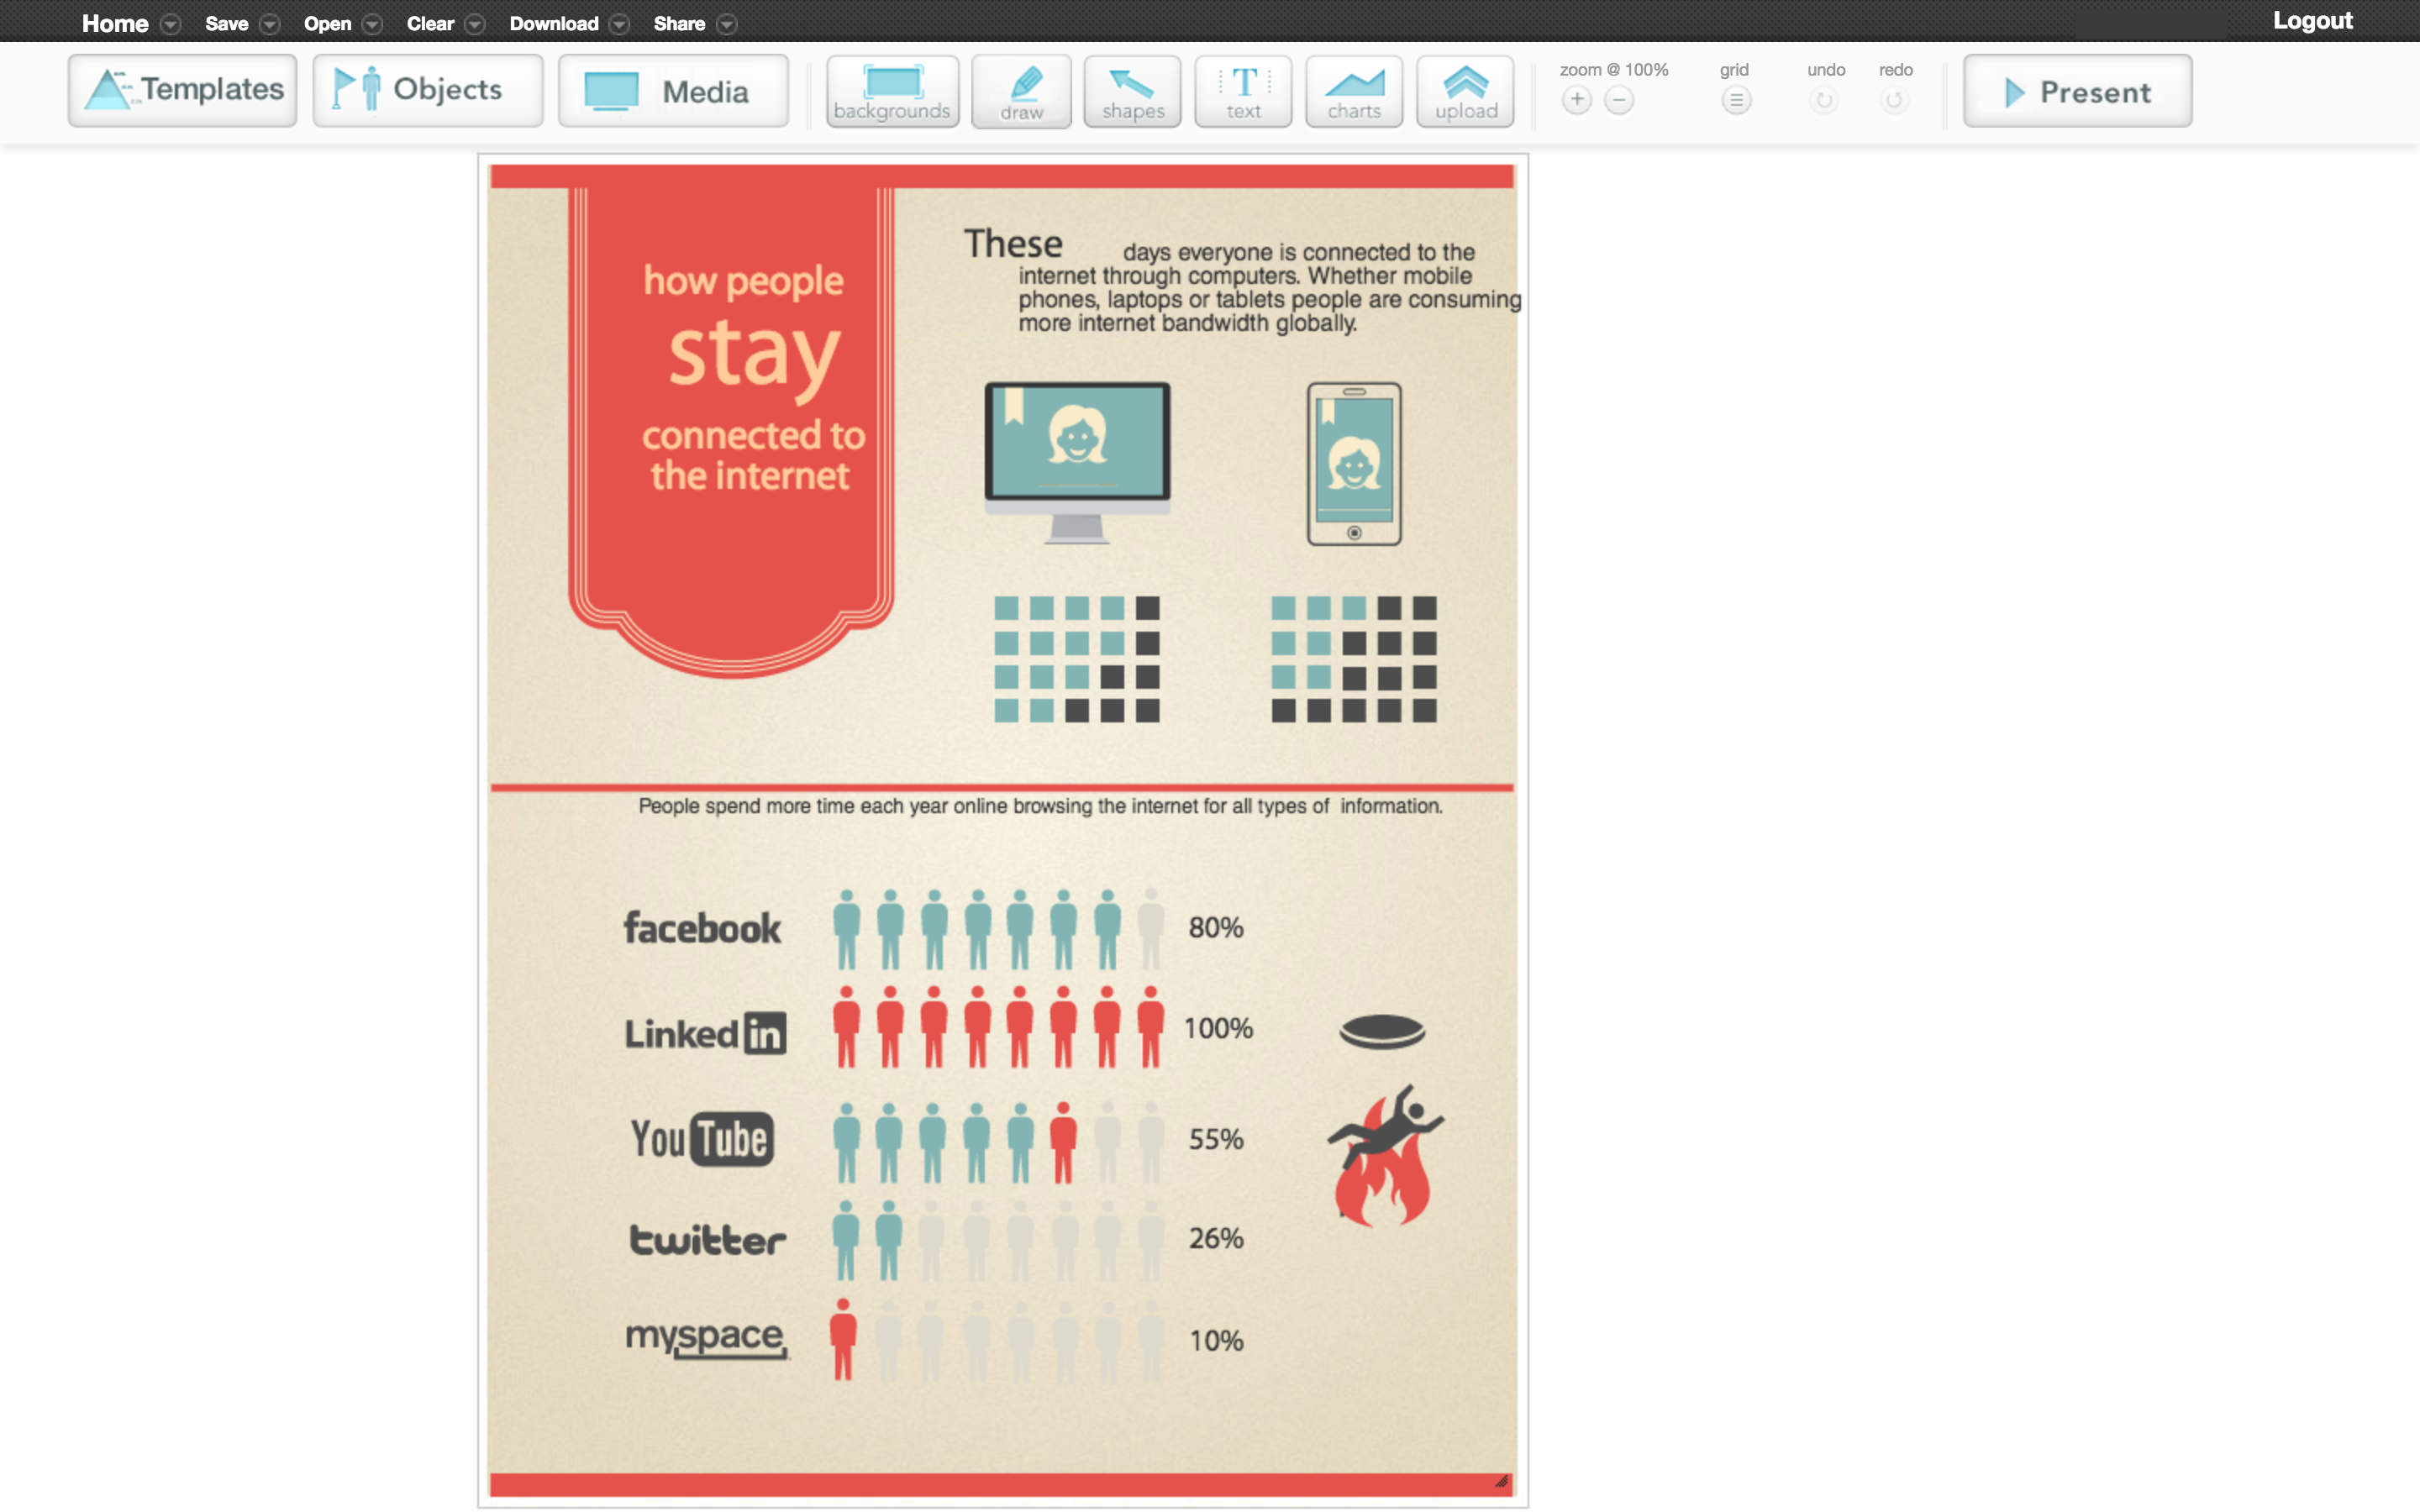
3. easel.ly
Easel.ly is a great program that focuses on infographic designs. Although they lack guidance on how to use the program and its features, the dashboard is easy to navigate and learn. It’s free, customizable charts, easy downloads for JPG and PDF, basic design and layouts.
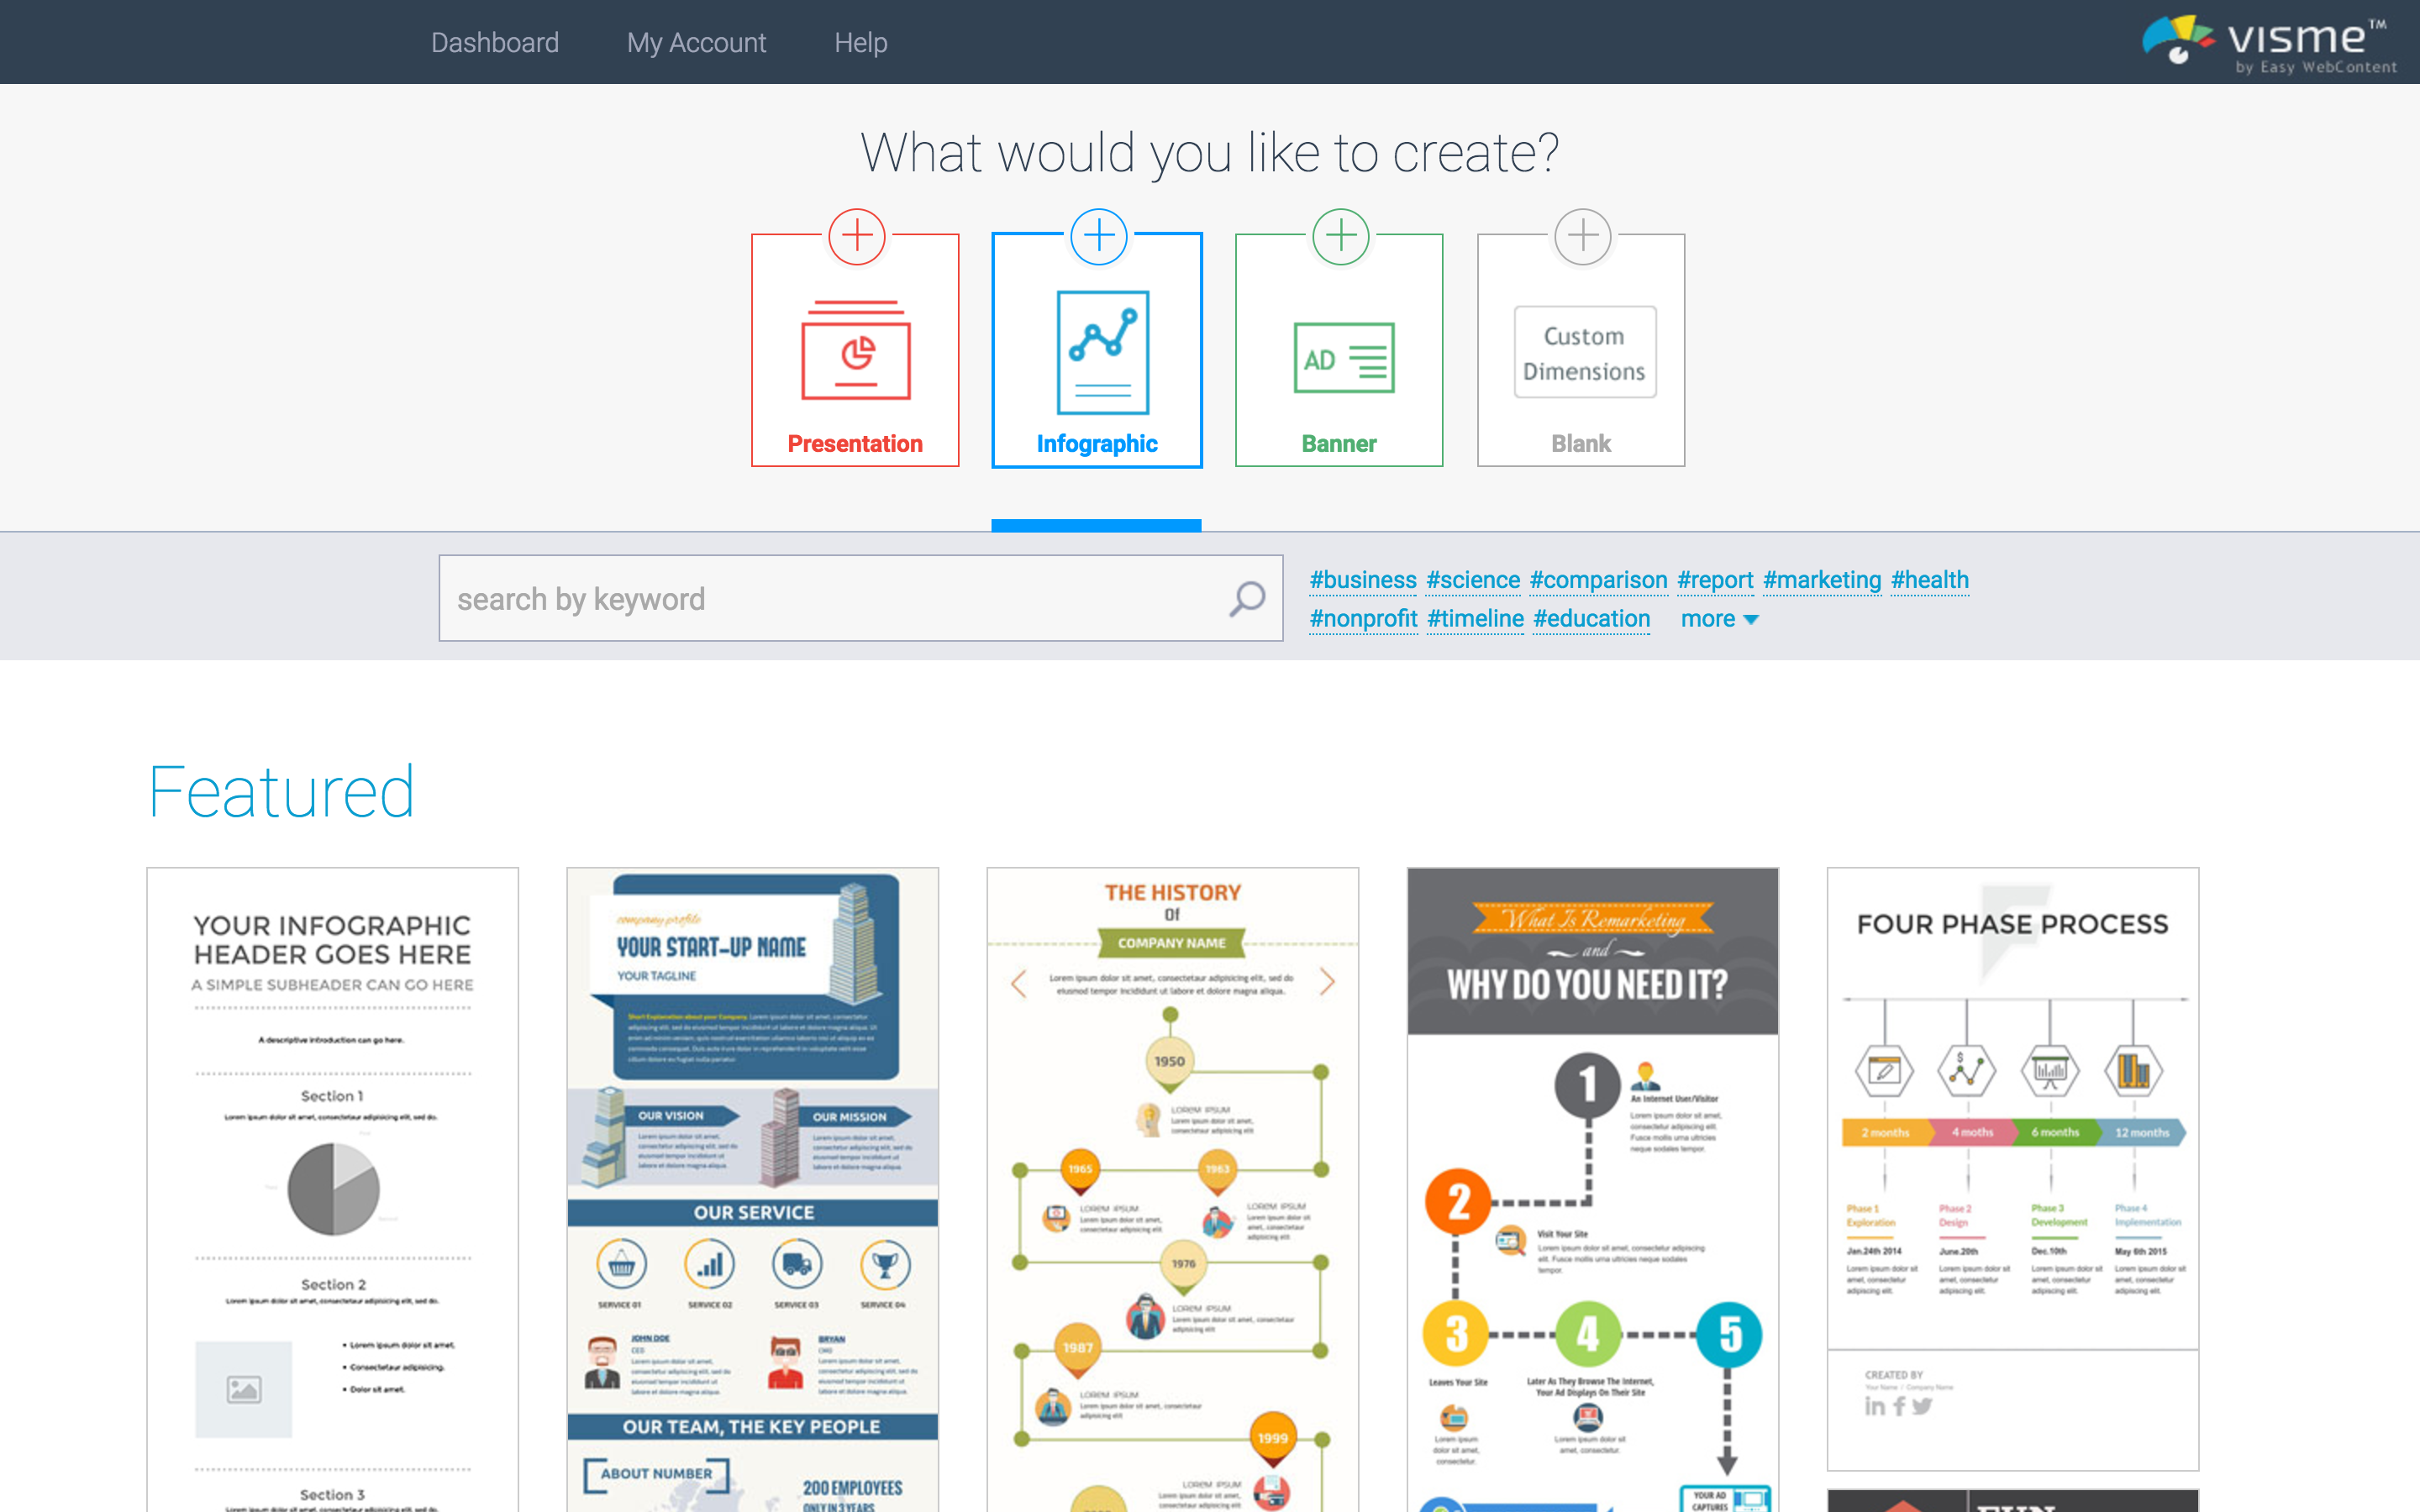
4. Visme
If you are looking to create interactive presentations, infographics and other engaging content, Visme is a tool you should consider. With a number of template selections for infographics and presentations, you can easily create a graphic without any design experience.
Any of the tools and services listed above are great avenues to get started on your infographic. They are all free, but if you wish to have access to even more templates, they all have an option where you can subscribe at a monthly rate.
It’s always nicer to present information visually than in text. You engage with the reader and also make your blogs, posts or presentations more unique. Once you get started on one infographic, it’ll be so much fun that you’ll want to make more.


.png)